Computing spectra (intensities and line lists)
Absorption or emission spectra as well as line lists, partition functions and other
related quantities can be computed by adding in the input file an
intensity section.
Here is an example of its general structure:
intensity
  absorption
  thresh_intens  1e-15
  thresh_coeff   1e-15
  temperature   300.0
  J,  0.5, 1.5
  freq-window  -0.001,  25000.0
  energy low   -0.001, 6000.00, upper   -0.00, 30000.0
end
If the keyword intensity is followed by none or off then the calculation of
intensities is disabled and the section is ignored. This is useful to temporarily
avoid the intensity calculation without removing or commenting out
the relative input section from the input file.
The meaning of the keywords is explained in the following.
Note
Duo input keywords are case-insensitive. In this manual we use lowercase for readability.
Batching over  ranges
It is possible to compute intensities in independent batches over
 ranges (e.g. 0–1, 1–2, 2–3, …). To prevent
overlaps when stitching line lists, transitions within the lowest of the
batch are omitted, i.e.
ranges (e.g. 0–1, 1–2, 2–3, …). To prevent
overlaps when stitching line lists, transitions within the lowest of the
batch are omitted, i.e.  are excluded
(except for
are excluded
(except for  , where
  are included).
Transitions
are included).
Transitions  are forbidden.
Each batch produces a partial .states/.trans pair that can be concatenated
to form a complete line list. Duo keeps the internal state numbering consistent
across batches.
Example:
INTENSITY
....
linelist CH_A-X
states-only
.....
END
** bound used in INTENSITY calculations to produce bound-only spectra or linelists. For bound, Duo
identifies bound wavefunctions corresponding to the upper state and uses them to compute bound transition intensities. See also Treating unbound states.
intensity
  absorption
  bound
  thresh_bound  1e-6
  thresh_intens 1e-15
  thresh_coeff  1e-15
  temperature   300.0
  J,  0.5, 1.5
  freq-window  -0.001,  25000.0
  energy low   -0.001, 6000.00, upper   -0.00, 30000.0
end
** unbound (opposite of bound) used in INTENSITY calculations to produce unbound-only spectra or linelists. For unbound, Duo
identifies unbound wavefunctions corresponding to the upper state and uses them to compute unbound transition intensities. See also Treating unbound states.
Example: Intensities of BeH
Here we use the potential energy function of BeH from the example Example: BeH in its ground electronic state.
For intensity calculations one needs an electric dipole moment curve, which we take from the spectroscopic model used in the ExoMol-I paper by Yadin et. al (2011)
dipole  1 1
name "<2Sigma+|DMZ|2Sigma+>"
spin   0.5 0.5
lambda  0  0
type   grid
values
   0.400     -0.4166624920
   0.500     -0.0241871531
   0.600      0.2217732500
   0.700      0.3386323420
   0.800      0.3661076190
   0.900      0.3311512400
   1.000      0.2513061130
   1.100      0.1379591390
   1.200     -0.0012406430
   1.300     -0.1588361650
   1.320     -0.1920270000
   1.340     -0.2256736540
   1.350     -0.2426539090
   1.360     -0.2597311920
   1.400     -0.3288944440
   1.500     -0.5056369720
   1.600     -0.6824442480
   1.700     -0.8513506410
   1.800     -1.0025214800
   1.900     -1.1238133700
   1.950     -1.1687609400
   2.000     -1.2005094800
   2.020     -1.2089972000
   2.050     -1.2166847200
   2.070     -1.2181089800
   2.100     -1.2136337000
   2.300     -1.0182994100
   2.400     -0.8538885220
   2.500     -0.6736179730
   2.600     -0.5046631750
   2.700     -0.3634556350
   2.800     -0.2548814520
   2.900     -0.1758884440
   3.000     -0.1201861300
   3.100     -0.0815224742
   3.200     -0.0549121655
   3.300     -0.0367099205
   3.400     -0.0243335573
   3.500     -0.0159701097
   3.600     -0.0103484461
   3.700     -0.0065800412
   3.800     -0.0040495078
   3.900     -0.0023383813
   4.000     -0.0011684378
   4.200      0.0002034367
   4.400      0.0008546009
   4.600      0.0011177434
   4.800      0.0011645509
   5.000      0.0011023829
   6.000      0.0005429083
   8.000     -0.0000033249
  10.000     -0.0000085504
end

intensity
 absorption
 thresh_intens  1e-30
 thresh_line   1e-30
 temperature   300.0
 linelist   beh
 j,  0.5, 10.5
 freq-window   0.0,  7000.0
 energy low   -0.001, 5000.00, upper   -0.00, 12000.0
end
This will produce a line list for BeH in ExoMol format in two files .states and .trans, which can be processed using ExoCross, see also ExoCross-tutorial.
Selective intensity calculations via the FITTING transition list
Duo traditionally offers least-squares refinement of diatomic models by fitting to experimental energies (term values) or frequencies (line positions) using the Duo fitting section. While refinement of transition-moment curves (electric dipole, magnetic dipole, electric quadrupole, etc.) against experimental intensities is a natural next step, it requires efficient control over which transitions are computed and compared to experiment.
As a first step towards intensity-based refinement, Duo can now reuse the
FITTING transition list to select a limited set of transitions for which
line intensities are generated. This simplifies comparisons with experiment
and can make the production of intensities significantly more efficient when only
a small subset of lines is required.
To enable this mode, add the keyword intensity immediately after FITTING.
This tells Duo that the FITTING section is used as a transition selector
for the intensity calculation. Without this keyword, FITTING and
intensity are treated as mutually exclusive in a single run.
Example: selecting transitions via FITTING
The usual fitting syntax for line positions is retained; the only addition is the
keyword intensity after FITTING:
fitting
intensity
lock    0 (cm-1)
frequencies                      ( state      v     ilambda isigma omega    weight  comment <-  state v ilambda isigma  weigh
      5.5 f        29   5.5  e      1       16725.21  a      0   1   0.5   1.5  x      0   0   0.5   0.5    0.0500        61uhak.1382
      5.5 f        27   6.5  f      1       16715.68  a      0   1   0.5   1.5  x      0   0   0.5   0.5    0.0500        61uhak.978
end
In this mode, Duo will compute intensities only for the transitions listed in
the frequencies (or energies) table, while still applying the usual
selection criteria from the intensity block (thresholds, spectral window,
energy windows, etc.).
Associated intensity block
A standard intensity block must still be present, since it defines the type of
spectrum and global controls (temperature, partition function, thresholds,
windows, and the range):
intensity
  absorption
  thresh_coeff  1e-60
  thresh_dipole 1e-9
  temperature   300.0
  Qstat  337.0515
  J,  5.5, 6.5
  freq-window  -0.001,  20000.0
  energy low   -0.001,  3000.00, upper   -0.00, 23000.0
end
Note
The effective transition set is the intersection of:
(i) transitions explicitly listed in FITTING and
(ii) transitions passing the filters defined in the intensity block.
Efficient use with checkpoints (recommended workflow)
Selective intensities are particularly effective when combined with checkpointing. A common workflow for refining or testing transition-moment curves without recomputing rovibronic states is:
Read eigenvalues/eigenvectors and vibrational basis functions from checkpoints.
Recompute only the transition-moment matrix elements for the current moment curves.
Compute intensities only for the selected transitions.
For example:
checkpoint
  eigenfunc read
  dipole   calc
  filename YO
end
Here, dipole calc instructs Duo to recompute the required moment matrix elements
using the stored vibrational basis functions from YO_vib.chk, while rovibronic
eigenvalues/eigenvectors are taken from YO_values.chk and YO_vectors.chk.
This avoids repeating the expensive diagonalisation step and allows rapid iteration
over alternative moment curves or parameters.
Tip
This mode is useful for “targeted” comparisons with experimental intensity data (or for future intensity-driven refinement), and for distributing intensity production over multiple independent jobs.
Keywords
absorption,emission,partfunc
These keywords define the type of the spectra
(absorption or emission) or whether Duo should only compute the partition function.
This keyword should appear immediately after intensity.
Example:
absorption
emission
partfunc
quadrupole
This keyword is used to trigger the calculation of electric quadrupole transitions (see also quadrupole).
magdipole(aliasmagnetic)
This keyword is used to trigger the calculation of magnetic dipole transitions (see also MAGNETIC).
J(aliasesJrot,Jlist)
This keywords defines the range of rotational angular momentum quantum numbers for which line transitions should be computed.
Note
jrot controls which rovibronic states are computed in the rovibronic calculation;
J inside intensity controls which transitions are processed into intensities/line lists.
Example:
J 0,10
Note
Using the J keyword the intensity production can be split into independent
J  ranges. In order to prevent overlaps, the range
does not include transitions
ranges. In order to prevent overlaps, the range
does not include transitions  , except for
  ,
where the transitions
,
where the transitions  are included. Transitions
  are forbidden.
LandeCompute Lande factors and write to the .states file.
energy lowandupper
These keywords to restrict the calculation to transitions between levels satisfying the specified lower and upper energy thresholds (in cm-1): In the following we select transitions for which the lower state is between 0 and 6000 cm-1 and the upper state is between 10000 and 30000 cm-1:
energy low 0.0, 6000.00, upper 10000., 30000.0
Note that in this context level energies are measured by setting the energy of the lowest energy level to zero,
i.e. they do not include the zero-point energy, in contrast with
the threshold enermax specified in the general setup.
Richmol(matelem) is to generate the RichMol checkpoints.
The RichMol checkpoint files .rchk can be used for laser-driven molecular dynamics;
see - .. [18OwYa] RichMol: A. Owens and A. Yachmenev, *J. Chem. Phys*, **148**, 124102 (2018), A general variational approach for rovibrational molecular dynamics in external electric fields..
RamanorPolarizabilityis to generate the matrix elements for the Raman intensity calculations with Richmol.overlapallows for printing vibrational overlap integral, aka Franck-Condon factors. This keyword is to trigger on/off the vibrational overlap integrals.
The default is on, for switching of:
overlap off
freq-windowspecifies a frequency window for line positions (in cm-1).
Example:
freq-window 0.001, 25000.0
gnsnuclear statistical weight (deprecated). It is now automatically estimated using nuclear spin values from the internal atomic and nuclear database.
gns specifies the nuclear statistical weight, which for heteronuclear diatomics
is given by 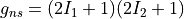 , where
  and
and  are the spins of the two nuclei.
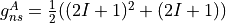
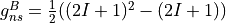
In the case of homonuclear diatomics four numbers are expected, one for each symmetry species of the
are the spins of the two nuclei.
In the case of homonuclear diatomics four numbers are expected, one for each symmetry species of the  or
or  symmetry groups.
Example:
symmetry groups.
Example:
GNS 3.0
For the or symmetries associated with the homonuclear molecules the  values must be specified for all of the four irreducible representation in the order
  ,
,  ,
,  ,
,  and
and  ,
,  ,
,  ,
,  , respectively.
GNS 1.0 1.0 0.0 0.0
The default is not to print (off). One can also explicitly switch the overlaps off by adding off next to overlap:
overlap off
The format is
< i, v| i', v'> = value
where i and i' are the electronic state numbers, v and v' are the vibrational labels and value is the overlap:
`` langle i,v | i’,v’ rangle.
``
* vib-dipole prints out vibrational transition moments  . By default these values are print out whenever the
 intensity is invoked. In order to switch this option off write off next to vib-dipole:
vib-dipole`` off
The format is
< i, v| <State | mu | State'> i', v'> = value
where i and i' are the electronic state numbers, v and v' are the vibrational labels, State is the electronic state label and value is the transition dipole moment.
Temperaturespecifies the temperature (in Kelvin) to be used for the calculation of line intensities.
It can be considered as a reference temperature since the Einstein coefficients as the main computational product and are temperature independent. The partition function associated with this Temperature should be also specified.
Example:
temperature 298.0
qstat(aliases:part-funcandQ).
- This keyword is
to specify the value of the partition function
 for the reference temperature defined by {
Temperature. If not given, is computed by Duo.
Example:
qstat 10.0
ZPE
This keyword defines the zero point energy (cm-1) used for the calculation of line intensities, overriding
the value specified by the same keyword in the EigenSolver input section.
It is important to explicitly specify ZPE when the ground rovibronic state (whose energy defined the ZPE)
is not included in the calculation. Omitting
this keyword corresponds to using as ZPE the energy of the lowest-lying level used in the calculation.
Example:
ZPE 931.418890
Thresh-intesspecifies a minimum intensity threshold (in cm/molecule) for printing the transition into theoutput file as well as into the line list.
Example:
Thresh-intes 1e-35
Thresh-Einstein
specifies a threshold for the Einstein coefficient (in 1/s) for printing out the transition into the output file as well as into the line list.
Example:
Thresh-Einstein 1e-50
linelistspecifies a file name for writing a line list in the ExoMol format.
Example:
linelist ScH
In the example above two files will be written, ScH.states, containing a list of energy levels,
and ScH.trans, containing the line transition data (line positions and Einstein  coefficients).
NspinNuclear spins of both atoms (depreciated).
Note
The nuclear spins are now provided in the internal atomic and nuclear databases and is not required to be specified anymore.
The nuclear spin values are used to define the nuclear degeneracy factors as follows. Example
nspin 0.0 0.5
- ::
nspin 0.0 0.0
The nuclear degeneracy factors (depreciated)  are defined as follows. For the heteronuclear molecules:
For a homonuclear diatomic, it is given by
and
where  and I are the nuclear spins and A and B are the two irreps of the D2h symmetry group.
Gnsis an alternative tonspindefining the nuclear spin degeneracy explicitly.
Example:
GNS 3.0 3.0
GNS 1.0 1.0 0.0 0.0
Thresholds
** thresh_line line strength threshold (Debye:sup:2)
** thresh_einstein Einstein A coefficient threshold (1/s).
** thresh_intens intensity (TM) threshold (cm/molecule)
** thresh_dipole transition dipole threshold (debye)
** thresh_bound density threshold to distinguish bound and unbound states.
** thresh_bound_rmax  threshold used to distinguish bound and unbound states.
**
threshold used to distinguish bound and unbound states.
** thresh_delta_r the value of the integration interval used to distinguish bound and unbound states.
states-only,states_only: to switch off the transition intensity when building the line list. When this option is given in
the INTENSITY block, only a .states file is generated.
Ryan P. Brady, Charlie Drury, Sergei N. Yurchenko, and Jonathan Tennyson. Numerical Equivalence of Diabatic and Adiabatic Representations in Diatomic Molecules. J. Chem. Theory Comput., 20:2127–2139, 2024. doi:10.1021/acs.jctc.3c01150.
R. P. Brady. A strict and internally consistent diabatic representation for coupled N-state diatomics: a hybrid asymptotic-property-based diabatization method. J. Chem. Phys., 162:174105, 2025. doi:10.1063/5.0260594.
Ryan P. Brady and Sergei N. Yurchenko. Spin-orbit induced non-adiabatic dynamics: an exact ω-representation. 2026. URL: https://arxiv.org/abs/2603.06306, arXiv:2603.06306.
Sergei N. Yurchenko, Lorenzo Lodi, Jonathan Tennyson, and Andrey V. Stolyarov. Duo: a general program for calculating spectra of diatomic molecules. Comput. Phys. Commun., 202:262 – 275, 2016. URL: http://www.sciencedirect.com/science/article/pii/S0010465516000023, doi:http://dx.doi.org/10.1016/j.cpc.2015.12.021.
Laxmi Prajapat, Pawel Jagoda, Lorenzo Lodi, Maire N. Gorman, Sergei N. Yurchenko, and Jonathan Tennyson. ExoMol molecular line lists - XXIII. Spectra of PO and PS. MNRAS, 472:3648–3658, 2017. URL: http://dx.doi.org/10.1093/mnras/stx2229, doi:10.1093/mnras/stx2229.
Sergei N Yurchenko, Emma Nogué, Ala'a A A Azzam, and Jonathan Tennyson. ExoMol line lists - XLVII. Rovibronic spectrum of aluminium monochloride (AlCl). MNRAS, 520(4):5183–5191, 2022. doi:10.1093/mnras/stac3757.
Qianwei Qu, Sergei N. Yurchenko, and Jonathan Tennyson. A variational model for the hyperfine resolved spectrum of VO in its ground electronic state. J. Chem. Phys., 157:124305, 2022. doi:10.1063/5.0105965.
W. Somogyi, S. N. Yurchenko, and A. Yachmenev. Calculation of electric quadrupole linestrengths for diatomic molecules: Application to the H$_2$, CO, HF, and O$_2$ molecules. J. Chem. Phys., 155:214303, 2021. doi:10.1063/5.0063256.
Wilfrid Somogyi, Sergey N. Yurchenko, and Gap-Sue Kim. An \textit ab initio spectroscopic model of the molecular oxygen atmospheric and infrared bands. Phys. Chem. Chem. Phys., 26:27419–27430, 2024. doi:10.1039/D4CP02619E.
Mikhail Semenov, Sergei. N. Yurchenko, and Jonathan Tennyson. Predicted lande g-factors for open shell diatomic molecules. J. Mol. Spectrosc., 330:57–62, 2016. doi:10.1016/j.jms.2016.11.004.